Your Dashboard shows the boat's latest reported position and readings. Check the update time before treating them as current. This page explains what each value and button means.
Open your dashboard
Signing in lands you there, and it is the Dashboard tab on a phone. Its address is saillogger.com/app.
The screen keeps itself current: your readings, the AIS traffic your own receiver hears, and the AIS Fleet, Friends and fleet layers refresh on their own. Leave it open and you normally do not need to reload it.
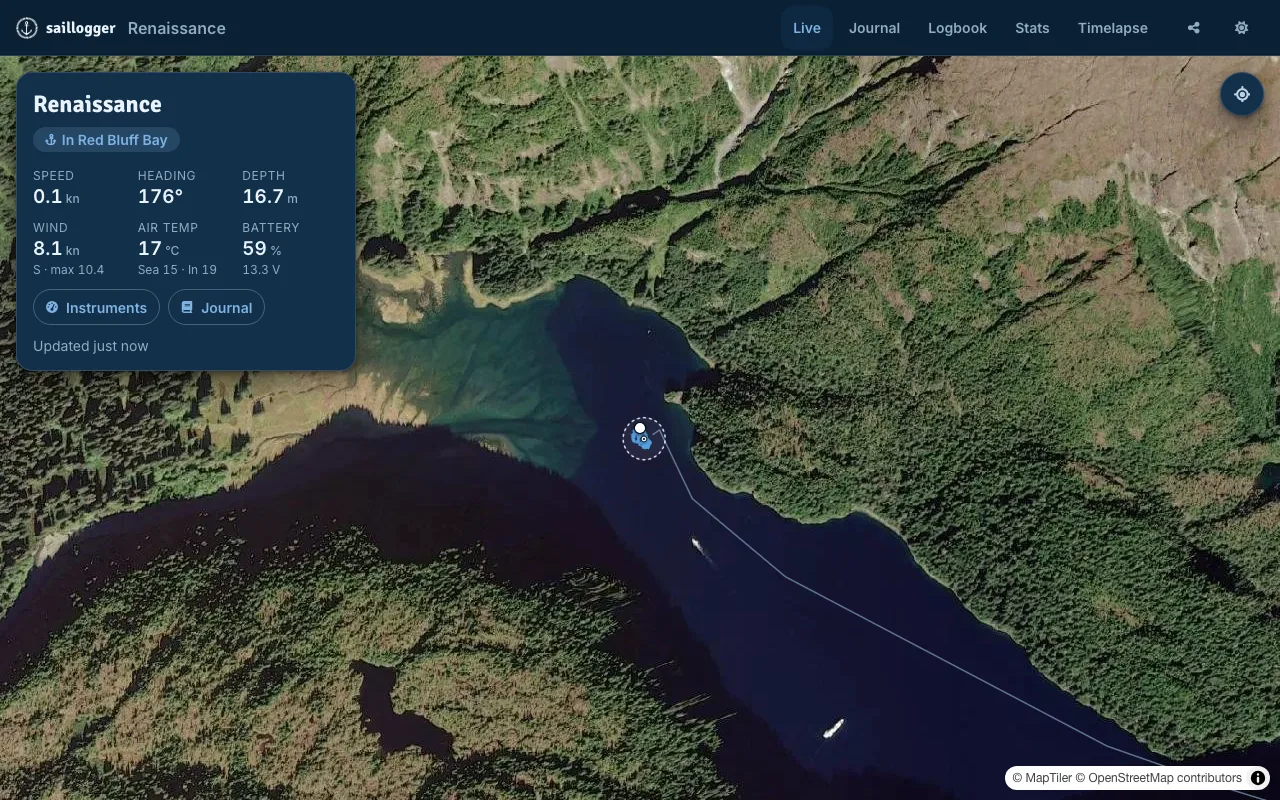
The boat card
The card is your boat at a glance, on the chart she is drawn on:
- Her name, and under it a status: Underway, or where she is, such as In Red Bluff Bay.
- The passage so far, beside that status while you are under way: how far you have run and how long you have been going, for example Underway · 42.6 nm · 8h 10m. It counts from where this trip began, not from the start of the cruise.
- Heading to
<place>, when you have set a destination. Otherwise the card shows your Make & model. - A row of headline readings: Speed, Heading, Depth, Wind with its direction and the last hour's strongest, temperature (air, with sea and cabin beneath it) and Battery with its voltage. A reading your boat has never sent is not shown at all.
- When it last reported, at the foot: Updated just now, or how long ago. If your boat has stopped reporting, the card says so.
Heading is true. A boat whose compass publishes only a magnetic heading is corrected for the magnetic variation at her position, so the figure can differ from her compass card by that amount.
The chevron at its corner folds the card down to a single pill, for when the chart matters more than the numbers. Tap the pill to open it again. Folded, it still carries her name, whether she is moored, at anchor or under way (her speed, while she is going), and how long ago she last reported. If she has stopped reporting, the pill says so in words.
Three chips sit at the bottom of the card:
- Instruments, the full gauge panel, below.
- Journal, this cruise's notes and photos: see Notes, photos and your journal.
- Share, which hands over your public live address. It reminds you that anyone holding that link can see where your boat is.
The instruments
Instruments opens the panel built from what your boat actually reports. A section your boat does not send is hidden, not shown empty. That is why two boats can have quite different panels, and why a section can appear the day you add a sensor.
- Wind and depth shows wind speed with a direction arrow, and depth. When Saillogger has a figure for the last hour it adds a
1h maxcaption underneath. - Temperature shows outside, inside and water temperature. Each one appears only if you have a source for it.
- Humidity shows inside and outside humidity.
- Battery is an arc for state of charge with the voltage printed in the middle. This is your main or house battery.
- Barometer shows the current pressure. Its trend line is different: it needs a few hours of readings behind it before it can draw anything, so a newly connected boat sees the number before it sees the line. Without a reading from around a day earlier, the daily change is left out.
- Any custom sections you have built yourself appear below these.
The wind arrow points where the wind is going
The arrow shows the direction the wind is blowing toward, not where it comes from. An arrow pointing south means a northerly.
Weather charts and wind barbs commonly use the opposite convention, so compare the arrow with its label when the direction looks unexpected.
Where wind direction comes from
The wind arrow uses true wind direction, environment.wind.directionTrue, when your instruments publish it. Most NMEA 2000 networks do not: they broadcast apparent wind. Then Saillogger calculates the direction itself from the masthead's apparent wind and the boat's heading, course and speed, the same wind over the ground it sends to Windy, so no extra plugin is needed. A magnetic heading is enough.
Why a value is blank
Saillogger leaves a reading blank when it is no longer current, so a blank does not mean zero. Check the sensor's timestamp, power and selected source.
The buttons on the chart
Three controls sit on the chart itself, and they are yours alone. Visitors to your public page see none of them.
- Map layers, which opens the panel described below.
- Set a destination, the flag. It appears only while you are under way.
- Center on your boat, for when you have panned away.
A panel you open from these buttons appears beside them, and the button stays lit while it is open. Close it with the × in the panel's corner, by pressing the same button again, with Esc, or by tapping the water. On a phone, and on any screen too narrow to hold a panel beside the chart, the panel slides up from the bottom instead. Pull its top bar down to close it, or tap the bar; on a vessel card, you can pull from the name at the top as well. The panels that belong to your boat card, Instruments and Journal, open beside the card rather than out here.
The card for a boat you tap on the chart opens beside that boat, with a small arrow joining the two, and it stays with her while you pan and zoom. It steps around your own boat card and around the buttons, so it can end up on either side of her. While it is open it covers that patch of water: to reach a boat underneath it, close the card first. On a phone the same card comes up from the bottom of the screen, where your thumb is.
Set a destination
While under way, press the flag and then tap the chart. Saillogger names the point, marks it with a checkered flag and puts Heading to <place> on your boat card. Tap the flag on the chart for the Distance to go, which updates as you cover the distance.
To move it, press the flag button again and tap the new spot. To clear it, tap the flag on the chart and choose Clear destination, which asks once before it goes.
The anchor circle
If a circle appears on the chart when you are anchored, it reflects the anchor position and radius published by your boat's anchor alarm (on a Signal K boat, as navigation.anchor). Change the alarm radius aboard and the displayed circle changes with it. Tap the circle for its Swing radius and how far the boat is from the anchor.
Some anchor alarms also send their own reading. The card then adds it, as the alarm reported it:
- Anchor alarm: Starting when the alarm has been set but is not watching yet, Holding when the alarm reports that the anchor is holding, Near the edge when the boat is close to the edge of the circle, and Dragging when the alarm reports that the anchor is dragging. How long ago the boat sent the reading follows it. If your boat has stopped reporting, the row says so.
- Alarm sound: Sounding aboard while the alarm reports Near the edge or Dragging with its sound on, and Silenced aboard when the alarm's sound has been silenced on board. The alarm itself keeps working; only its sound is off. When the alarm counts its silence down and reports how long is left, the row also says when it will sound again.
- Distance from anchor: the alarm's own measurement, in place of the one calculated from the boat's last position. Under it, once the boat has reported for a few minutes, a second line says what the distance has been doing over the last quarter of an hour, for example up from 31 m, 14 min ago; still rising or steady for 12 min: a boat that keeps moving away from her anchor reads differently from one that swung once in a wind shift and then settled. A steady duration covers the reported interval and ends at her last report.
- Furthest from anchor: the furthest the boat has been from the anchor, as the alarm reports it.
While the alarm reports Near the edge or Dragging, your boat card says so too: folded, it shows the alarm's word, and open, it adds a line such as Anchor alarm: Dragging that opens the anchor card. While the alarm's sound is silenced aboard, the folded card shows a crossed-out bell beside the word and the open card's line adds silenced aboard. This also applies while Saillogger still shows your boat as under way. Once your boat stops reporting, neither appears. The circle turns red while the alarm reports Dragging.
Only you see the alarm's reading; visitors to your public page see the circle alone.
As long as your boat sends a circle, Saillogger can also alert you, by e-mail or on your phone, when she leaves it or her alarm reports Near the edge or Dragging. How those alerts work, and how to switch them off, is on Alerts and notifications.
Adjusting the alarm from Saillogger
Some anchor alarms can also take a change from Saillogger. When yours can, the anchor card ends with two buttons; when it cannot, the card has no buttons and nothing else changes. The buttons also go if the alarm has not been in touch with Saillogger for a couple of hours, and come back with its next report.
- Adjust radius opens a stepper. The new circle is drawn on the chart beside the current one while you choose, and the boat keeps her anchor position. If the new radius is smaller than the boat's distance from the anchor, or smaller than the furthest she has been during this watch, the card says the alarm may sound aboard, and asks you to confirm with a second tap.
- Silence alarm appears only while the alarm reports Near the edge or Dragging and its sound is not already silenced. It asks once before it sends: anyone aboard will no longer hear the alarm, and Saillogger pauses its own anchor notices while the boat reports it silenced (for how long, see Alerts and notifications). It works exactly as the silence button aboard does: the alarm itself keeps watching, and how long the sound stays off is the alarm's own rule.
A change is sent to the boat, not made by Saillogger. The card follows it in one line: waiting for the boat's next report (a request can be withdrawn while the boat has not yet picked it up), then the boat's answer. The boat can decline a change, for example when her anchor watch was changed aboard in the meantime, or when the alarm you answered was no longer sounding. The Swing radius and Alarm sound rows change only when the boat's next report carries the change. A silence the boat has not picked up within two minutes lapses, and the alarm is not silenced; a radius change waits up to an hour for the boat's next report. Every change the boat applies is also recorded in your notifications, naming who asked for it.
Your track is drawn behind you, so the boat swinging at anchor overnight shows on the chart as it happens.
Map layers
Map layers opens Show on map. The layers are yours alone: visitors to your public page never see which you have on, or the fleets and friends they name.
| Layer | Colour | On by default | What it holds |
|---|---|---|---|
| Track | yes | Your own cruise track behind the boat | |
| Places | yes | The stops and notes of this cruise | |
| Local AIS traffic | magenta | yes | Only what your own AIS receiver can hear |
| AIS Fleet | slate | no | Broader AIS coverage for the part of the chart you are viewing; busy areas may show a limited set |
| Friends | green | yes | Boats you follow |
| One row per fleet | amber | yes | The members of that fleet |
| My vessel photos | gold | yes | Vessels you have photographed |
Each row carries a live count of what is on the chart. A layer that is on with nothing to draw says None nearby rather than disappearing. In a busy area, AIS Fleet may say that more vessels are out there than the chart is drawing.
My vessel photos appears once one of your photos is published in a vessel's gallery, and not before. It shows every vessel you have photographed, in gold, each at her latest recorded position and not only the ones near you. A vessel that has not been heard from lately is still drawn, faded, and her card leads with when she was last seen: that mark is where she was, not where she is. Her speed, heading and distance are left off rather than repeated from an old report. See Vessel photos.
Show all and Hide all, at the top of the panel, set every layer at once, which is quicker than working down the rows when you belong to several fleets. Show all includes AIS Fleet, which is otherwise off by default; Hide all leaves only your boat on the chart. Your choice is remembered, as it is for a single row.
Joining a fleet later puts it on your chart, whichever way you last set these: a newly joined fleet is always shown.
Local AIS traffic and AIS Fleet can overlap. They may differ because your own receiver and the broader AIS coverage do not always hear the same vessels at the same time.
Find a boat on the map
The modern app's map can find a boat by name, MMSI, call sign or IMO number: the magnifier button opens the search. Results are listed closest to your boat first, with your own boat, boats you follow and your fleet-mates ahead of ordinary traffic. Pick a boat that has reported recently and the map takes you to her and opens her card. A boat that has not been heard for a while opens her card without moving the map, and the card says how long ago she was last heard. She stays on the chart for as long as she is selected.
Wikipedia points of interest
Saillogger shows a handful of Wikipedia places near the boat, each with a short extract from the article. It is on by default.
To turn it off, open Settings, go to Dashboard, and switch off Wikipedia points of interest.
Choose where the displayed cruise begins
Show my cruise from defines the historical range shown on your dashboard and in your journal.
Your chart can draw the whole cruise behind you, not just the current trip. It does that from one setting: Settings > Dashboard > Show my cruise from. You pick a trip, and Saillogger draws everything from that trip onward.
With Latest position only chosen instead:
- there is no historical track on the chart, only the trip you are on
- the journal panel and the journal page are empty because no display range is selected
A blank journal usually means no starting trip is set for your cruise, so Saillogger has no range of trips to collect notes from. Setting the starting trip makes those existing entries visible.
Saillogger normally sets this for you after your first trip, so a blank one usually means a new account, or one where the setting was cleared.
To set it:
- Open saillogger.com/app/settings/dashboard.
- Find Show my cruise from at the top of Dashboard.
- Choose the trip your cruise starts with. Choose the oldest trip in the list to draw your entire history.
- Reopen your dashboard. Your track and your journal are both there.
To clear it again, choose Latest position only, the first entry in the same list.
What else you can tap on the chart
Your own boat's story is the card, above. Everything else on the chart opens a card of its own:
- Another vessel, whether she came from your own receiver, from AIS Fleet, from Friends or from a fleet. The card names her, then carries whatever AIS knows about her: MMSI, Status, Speed, Heading, Type, Size, where she says she is bound, how far off she is and when she last reported. A row her broadcast does not carry is left out rather than shown empty. Status can name where she is once her reporting confirms she has stopped, or where she left from while under way. If a place name is unavailable or being refreshed, the line can say Moored or Underway without one; her map position still comes from her latest report. A photograph comes with it when the catalog has one, and you can add one yourself. Depending on the boat and how you are connected to her, the card also lets you follow or message her, draw her last 24 hours, or add her to a fleet you own. Add to fleet opens a sheet listing your fleets; choose one to add her, and the sheet reports the result. A boat that logs with Saillogger carries a link to her pages.
- Your destination flag, with the Distance to go.
- Your anchor circle, with its Swing radius, how far the boat is from the anchor and, if your anchor alarm sends it, the alarm's own reading.
- A Wikipedia place, with the opening of its article and a link to read the rest.
History charts
The instruments show current readings. For the last day or week, go to History: saillogger.com/app/history. You can look at 24 hours, 48 hours or 7 days, including your own custom sections.
If a sensor or custom section sent nothing during the period you are viewing, its chart is replaced by a short note with the time of its last reading.